A stem and leaf plot is similar to a histogram but instead summarizes the set of information and then provides additional data. The numbers above are listed from greatest to least vertically and least to greatest horizontally. They are also divided up by tens.
Tuesday, April 3, 2012
Stem and Leaf Plot
A stem and leaf plot is similar to a histogram but instead summarizes the set of information and then provides additional data. The numbers above are listed from greatest to least vertically and least to greatest horizontally. They are also divided up by tens.
Box Plot
A box plot is an easy way to graph five sets of data: the minimum, lower quartile, median, upper quartile, and the maximum. A box plot may also indicate if there are any outliers. This particular box plot that is used as an example shows the different speeds of light.
Histogram
A histogram shows geographical information through the distribution of data. Histograms use bars to represent the information in the table. It also is similar to a population profile, having information both on the horizontal axis and the vertical axis.
Parallel Coordinate Graph
The parallel coordinate graph demonstrates a geometrical method to scale dimensions through parallel lines. Lines will usually begin at the lowest possible value and then fluctuate throughout the graph.
Triangular Plot
A triangular plot has three variables that sum up to a constant. It depicts rations of the three variables in an equilateral triangle. This type of map happens to analyze the different soil types, with the three variables being clay, silt, and sand.
Windrose
Windrose is used by meteorologists to determine the speed and direction of wind in a particular region. Windroses were designed after compasses. The windrose also uses colors to determine the variety of wind speeds.
Climograph
A climograph shows the basic climatic parameters of both precipitation and temperature, as shown in the graph above. This picture has the months on the horizontal axis with both the temperature and the precipitation on the vertical axis.
Population Profile
Population profile maps are similar to scatterplots in that they both take information that is conveyed through the horizontal and vertical axis. The difference is that while a scatterplot uses dots, population profiles use bars. In this image, the horizontal axis shows the population in thousands, while the vertical axis shows the age in years. The ultimate goal of the graph is to show those with and without AIDS.
Scatterplot
Scatterplots are a type of math diagram that portrays two different sets of data. The data is displayed through points, with one set of information on the horizontal axis and the other set of information on the vertical axis. The image above shows what a scatterplot looks like. On the horizontal axis, it demonstrates the eruption duration time, while on the vertical axis it shows the waiting time between eruptions of Old Faithful.
Index Value Plot
The Index Value Plot is commonly used to measure daily stock values. In the picture above, an inflation adjusted stock price index in India is seen from 1965-2008. When maps such as this are used, it can be slightly difficult to read, especially if it accumulates a lot of information throughout a long period of time.
Accumulative Line Graph
An accumulative line graph shows a set of data on a single line. Since it is cumulative it shows the information from the entire time period. This line graph shows the different defects and their percentages.
Bilateral Graph
This is an example of a bilateral graph. Sometimes information will be shown in positive or negative ways, or even represented in two different graphs. These graphs illustrate two different sets of data onto one line.
Nominal Area Choropleth Map
This map represents a nominal area choropleth map. The values here are calculated for area and show a series of discrete values. These units are conveyed through the use of colors. Typically the darker the color the more of a particular value the area has.
Unstandardized Choropleth Map
The image above is a great display of an unstandardized choropleth map. This type of map usually conveys statical data for large regions or countries. This map shows the percent change in population by each state in America. It is interesting to see that Florida is at the United States average.
Standardized Choropleth Map
The standardized choropleth map uses easy methods to make maps as simple to read as possible. These types of maps typically compare similar data. This map shows the population density per square mile in each state within America.
Univariate Choropleth Map
This map is an example of an univariate choropleth map. It shows the estimated median household income in the United States. The darker reds represent higher income with the lighter red being lower income. These maps are great to recognize demographic patterns and are typically easy to read.
Bivariate Choropleth Map
A bivariate map displays two variable on a single map by combing two completely different sets of symbols or colors. It shows a variation of a simple choropleth map while simultaneously showing another. The main goal of a bivariate map is to find a relationship between the two variables. This map happens to show the total number of people with a disability and the unemployment rate per county in North Carolina.
Unclassed Choropleth Map
This image falls under the category as an unclassed choropleth map. Instead of using circles to represent an increasing value, this picture uses darker shades of colors. It maps the proportion of children aged 0-15 and allows its viewers to realize the increasing age without an actual key to look at.
Classed Choropleth Maps
This choropleth map is an example of a classed choropleth map. A classified choropleth map compares sets of data against each other. The difference in this case would be the colors ranging from purple to green. This map shows the one-year forecast change in jobs in the United States.
Range Graded Proportional Circle Map
The above image is a good example of a range graded proportional circle map. This map is another way to show information through the form of circles, and sometimes there will be multiple data found within the circle. The picture above shows the Emerging Infectious Diseases around the world. It is evident that the northeast United States and Europe have a significant amount of EIDs.
Continuously Variable Proportional Circle Map
The map above represents a continuously variable proportional circle map. It tracks information through the use of pie charts and continuous growing circles. Each shading illustrates a different range of values. Although it is difficult to read, it is evident that the pie charts are changing and are not the same as the proportional circle map.
DOQQ
DOQQ (Digital Orthophoto Quarter Quads) maps are aerial photos produced by the USGS. The photography is at a resolution of one meter and image displacement has been removed. The above image is a color infrared picture that was taken in 1998 in Johnston County, Nebraska.
DEM
A DEM (Digital Elevation Model) is a 3D model of terrain's surface, which includes planets such as the earth, the moon, and asteroids They depict levels of elevations on land. The image above portrays a DEM of the world.
DLG
A DLG (Digital Line Graph) is a map shown in digital vector form. They are distributed in either large, intermediate, or small scales with up to nine different features. The DLG is similar to the DRG in that it originates from a paper map and shows roads and contour lines, such as the map above.
DRG
A DRG (Digital Raster Graphic) map is a scanned image of a topographic map. DRG maps are used for the basis of roads and rivers. This allows closer examination of a map of the earths surface. This map of Washington D.C. is a great example of this.
Isopleth
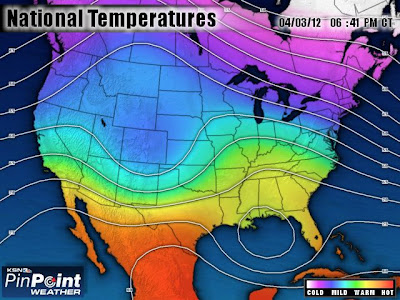
Isopleths are a series of lines that connect an equal value. These maps can show anything from precipitation or temperature, even up to surface elevations and atmospheric pressure. Isopleths will never cross or touch each other always form enclose circles. The map above shows isopleths of the temperatures in the United States.
Isopach
An isopach map illustrates the variation of thickness within a certain unit. They are contour lines of equal thickness in a geographic area. This image is of the rocks at the top of the Lansing Group in the Victory field in Kansas. It shows the differences in rock levels relative to the sea level. These types of maps are made by subtracting the depth in hole at the top of the rock from the depth of the base of the rock.
Isohyets
An isohyet is a map that joins together points of equal precipitation. This map shows the mean number of rainfall during the month of October on the Island of Kaua'i in Hawaii. As shown, the center of the island receives the most rainfall at about seven hundred mm.
Isotach
An isotach is a line on a weather map that connects points where winds of the same speed have been noted. The different colors represent a variety of weather conditions. Isotachs are also usually depicted in areas of similar elevation or atmospheric pressure. This map shows the wind speeds of the United States.
Isobars
Isobars are lines drawn on a map to demonstrate atmospheric pressure. The closer the isobars are to each other, the stronger the wind pressure will be. Isobars will also never touch or cross each other.
LIDAR
LIDAR (Light Amplification by Simulated Emission of Radiation) uses a 3D image to measure distance or other areas that can be illuminated by light. A laser is used to capture a picture of the earth and display depth, this process is known as Active Remote Sensing. The picture above actively demonstrates these principals by converting the building to 3D.
Doppler Radar
A doppler radar is a special radar that uses the features of doppler to produce velocity data about objects at a certain distance. The doppler radar observing unit can track ways that weather shifts. These help meteorologists determine the weather so that the public knows what is going on. This image is from the Environment Canada maps and shows the radial velocity of the storm.
Black & White Aerial Photo
This picture is an example of black and white aerial photography. These pictures a useful because they show a geographic area's boundaries and can consist of farming, cities, or even just roads. This picture is of Bryant University in Rhode Island and shows parking lots, a gym, residence halls, and pond.
Infrared Aerial Photo
Infrared photography are sensitive to infrared lights. It can be used to document changes in the environment, the health of forests and oceans, and it can even monitor damages to roofs or to track insects or disease in vegetation. This picture shows vegetation patterns through infrared aerial photography.
Cartographic Animations
Cartographic animation is the act of applying animation to a map to convey a change in some dimension. It portrays real time movement of features, like wind, rain, or hurricanes, over a geographic region. The picture above shows a hurricane hitting the west coast of Florida. This was taken in real time, displaying the changes of the storm every so often.
Statistical Map
A statistical map shows the change in a variable through statistical information. These maps work to show the deviation in quantity for a given factor. Maps can portray a variety of information, such as rainfall or populations of a geographic region, or in this case the average time it takes for a person to travel to work in the United States. It is interesting to see that Florida falls under the second longest category, with it averaging out to be around 24.1-26 minutes to get to work.
Cartograms
A cartogram is a map in which the land has been distorted to convey information on whether a country has more or less of an item. There are two main types of cartograms: area and distance. The map above is an area cartogram, which scales the map relative to the country's population.
Flow Map
A flow chart is a mix of maps that show the movement of object from one location to another, like people migrating or countries exporting products. Flow maps have a central location and then begin to spread. In this picture, it is clear that Europe is the centralized location to where the flow map began.
Isoline Map
An isoline map is a map with contouring lines that join points together. These maps can be used for numerous features, such as wind speed, altitude, temperature, wind direction and more. They are basically a two-dimensional representation of of three-dimensional model. This picture shows a value of the United States and how it will change over time.
Proportional Circle Maps
This proportional circle map shows the number of internet users in the world during 2007. Proportional circle maps use circles in either countries or major cities to represent a certain function. Circles increase as the quantity of internet users increases. As shown, the United States, China, Japan, England, and Russia are just some of the major internet using countries.
Choropleth Map
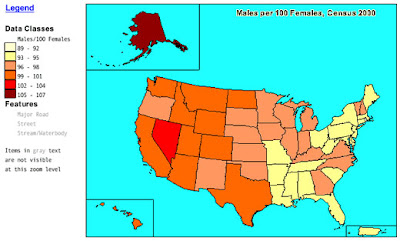
A choropleth map uses shades of colors or patterns to show statistical information about regions or countries. These types of maps also make it easy to see how a measurement varies across a geographic area. For example, this map illustrates the amount of males per one hundred females in the United States during the year 2000. Both the scales used in the maps and colors vary depending on the number of items given.
Dot Distribution Map
The map above is a great example of a dot distribution map. A dot distribution map shows the density of a certain circumstance through the usage of dots. This particular map is helpful because it shows what areas in the United States are more populated than others. As you can see, the east coast (especially the northeast) is more populated than the west coast during the year 2000. It also says that each dot represents 7500 people. It is easy to tell where the major cities in each state are located.
Propaganda Map
Propaganda maps are false maps, usually dealing with politics, to express certain beliefs. There are three types of categories that qualifies a map to be propaganda: scale and generalization, projection, and design and layout. It is also common for propaganda maps to depict acts of war, such as this one that shows how the United States and the USSR union face each other during the Cold War.
Hypsometric Map
Hypsometric maps use colors to illustrate the elevation of terrain. The above picture of France has contour lines that represent a specific shading. Usually lighter and brighter colors are used, with lighter colors being lower elevation and darker colors being higher elevation. As the picture shows, the darker lines represent high peaks.
Monday, April 2, 2012
PLSS Map
The above map illustrates a PLSS (Public Land Survey System) map. A PLSS helps show people the subdivision of land in different states, countries, and other areas. This PLSS shows the principal meridians and base lines for the United States. It uses a grid system to separate the townships and sections and clearly represents each state.
Cadastral Map
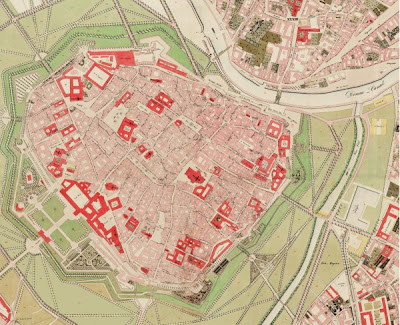
A cadastral map shows the ownership or boundaries of a certain country or location. This cadastral map is one of Wien, Austria back in the mid 1800s under the rule of Franz I. This is a good example of what areas he ruled during his time.
Thematic Map
The following is a Thematic Map showing the soil moisture regimes of the United States. A thematic map allows viewers to see information about a certain area graphically. This map expresses the soil moisture, with Udic soil being the most common among the states.
Topographic Map
The above map is a topographic map of Speculator Village and Lake Pleasant in New York. Even though the map is flat, contouring shows the elevation of the land through each line. Circles in the middle represent the peaks of mountains, while the surrounding lines show the rise or fall in elevation. This map illustrates a variety of elevation levels throughout the area.
Planimetric Map
A planimetric map only shows horizontal features that have no regard to elevation. The above picture of Tallahassee, FL is a great example of a planimetric map. These maps show roads and buildings that can be used for directions from one place to another.
Mental Map
This is a mental map of the Walt Disney World Resort. The map is not drawn to scale and the landmarks are not drawn to proportion. It essentially gives a vague sense of an area to its viewer. Although no hotels or resorts are shown, the map illustrates each Disney park to show where it is basically located.
Subscribe to:
Comments (Atom)


