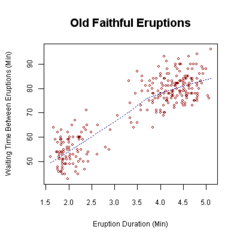
Scatterplots are a type of math diagram that portrays two different sets of data. The data is displayed through points, with one set of information on the horizontal axis and the other set of information on the vertical axis. The image above shows what a scatterplot looks like. On the horizontal axis, it demonstrates the eruption duration time, while on the vertical axis it shows the waiting time between eruptions of Old Faithful.
No comments:
Post a Comment