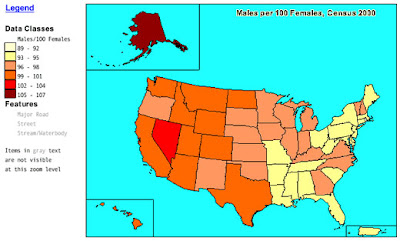
A choropleth map uses shades of colors or patterns to show statistical information about regions or countries. These types of maps also make it easy to see how a measurement varies across a geographic area. For example, this map illustrates the amount of males per one hundred females in the United States during the year 2000. Both the scales used in the maps and colors vary depending on the number of items given.
No comments:
Post a Comment